Warehouse Productivity Dashboard

🧠 Problem
Limited visibility into current workload and performance
Time spent switching between systems or manually assessing data
Difficulty identifying bottlenecks or imbalances in work allocation
Cognitive overload when interpreting dense operational data
Operators needed a way to quickly understand workload and performance at a glance, without disrupting ongoing operations.
🎯 goal
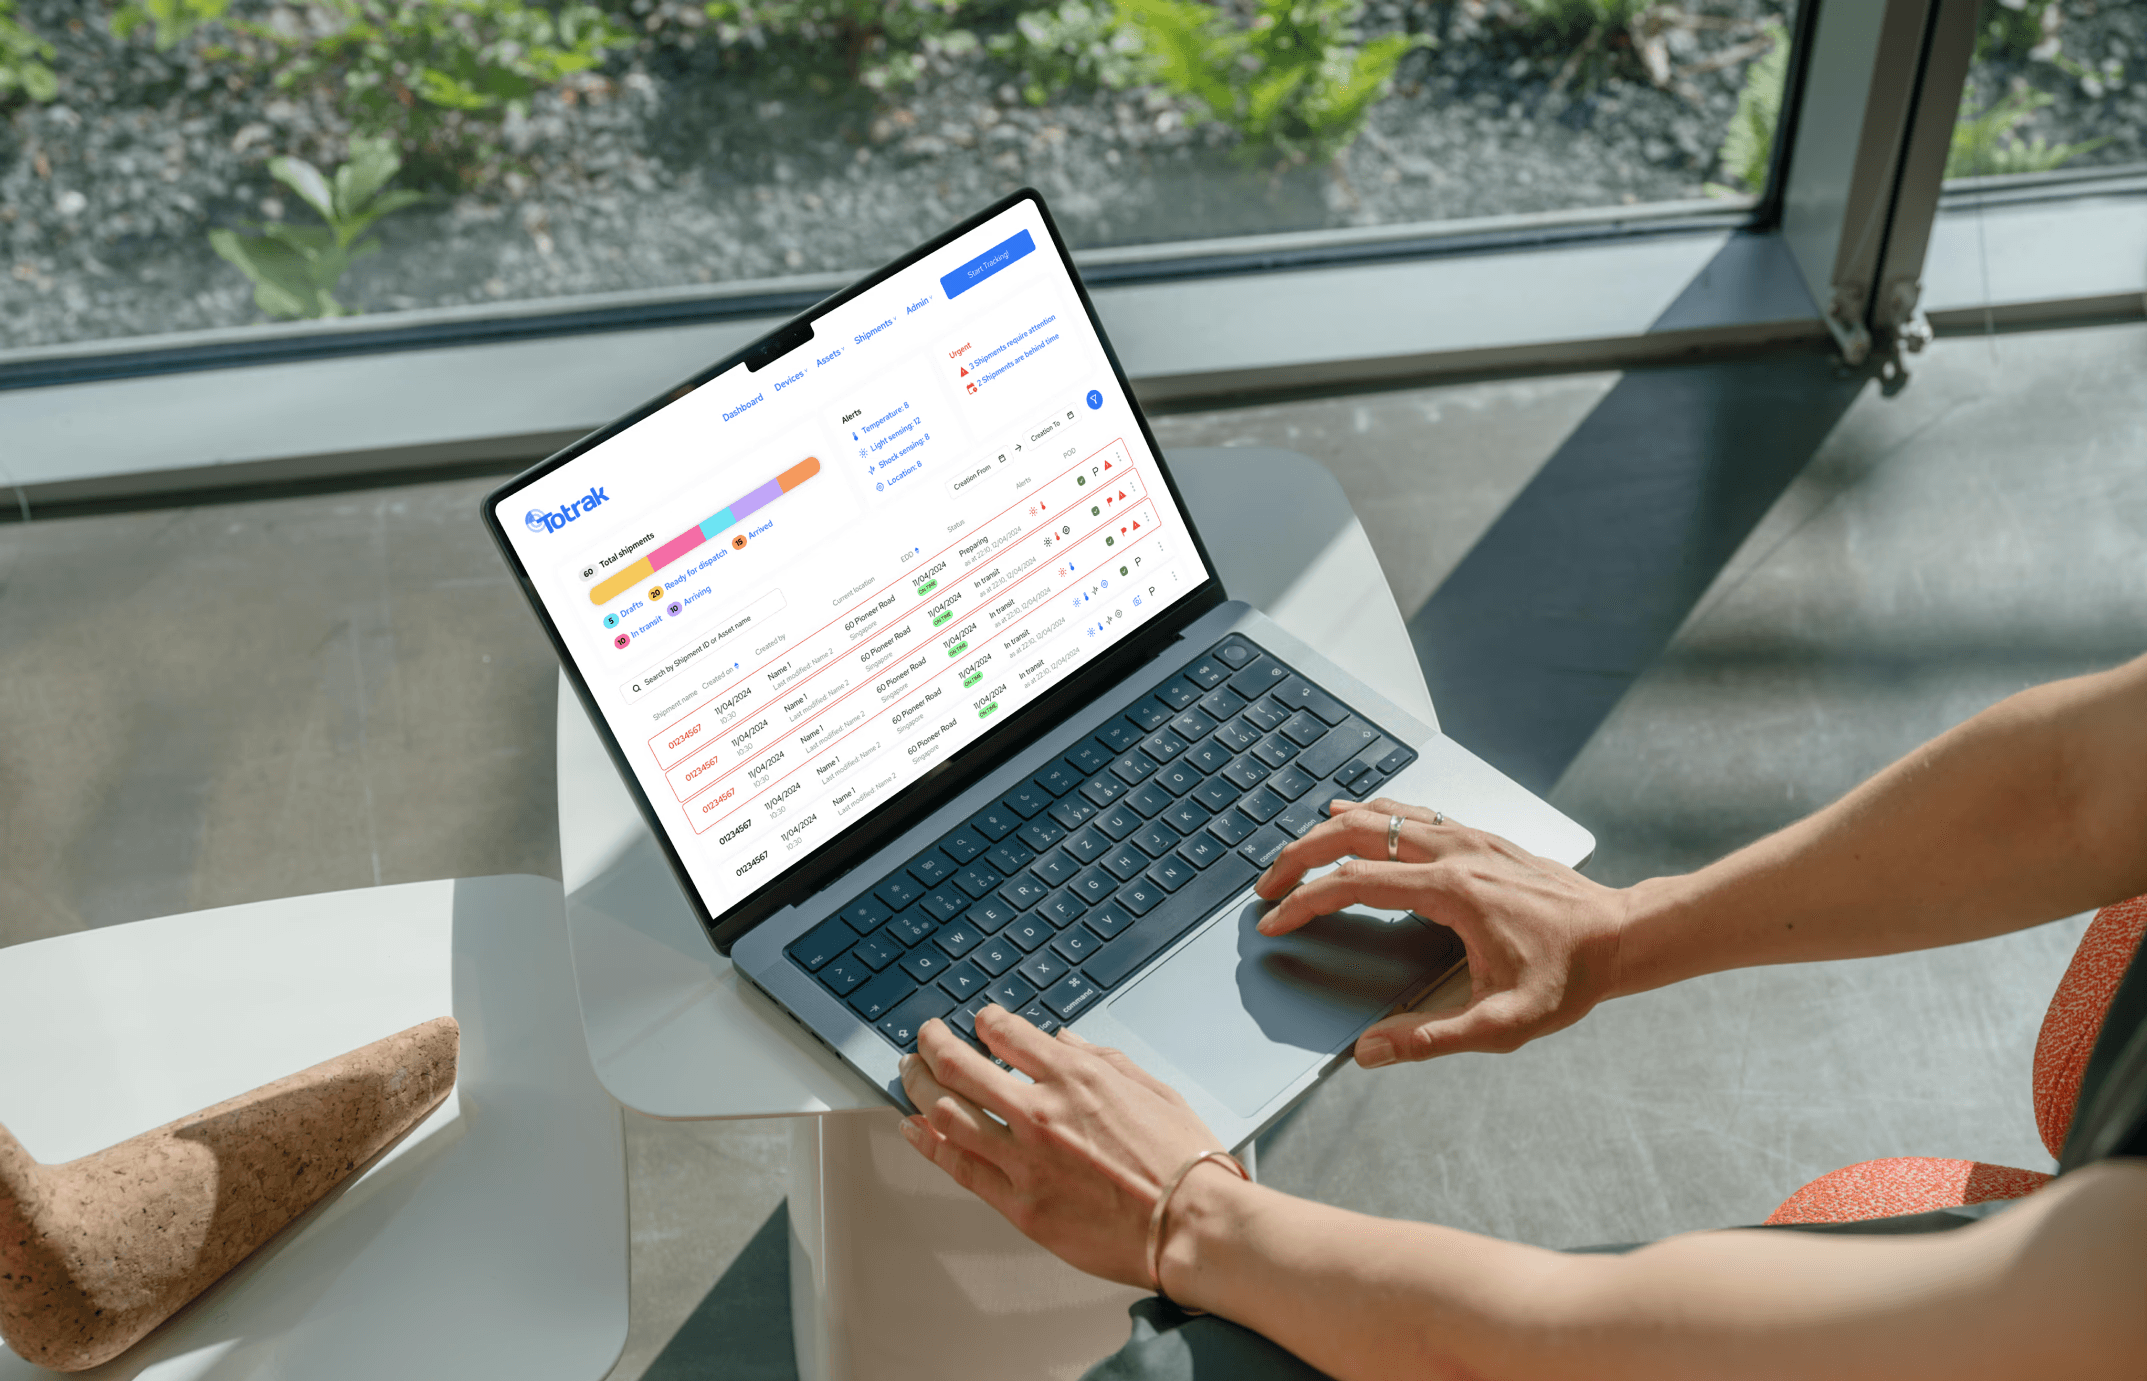
Centralises work allocation and productivity into a single view
Improves real-time visibility for warehouse operators
Enables quick assessment without adding cognitive load
Aligns with how operators naturally monitor and manage work
⚙️ Approach 1
Brought work allocation and productivity data into a single dashboard view.
👉 Eliminates the need to switch between multiple sources.
⚙️ Approach 2
Structured information to be quickly scannable:
Clear hierarchy of key metrics
Minimal visual clutter
Emphasis on critical data points
👉 Enables fast understanding in time-sensitive environments.
⚙️ Approach 3
Designed the layout based on how operators:
Monitor workload
Assess performance
Make quick adjustments
👉 Ensures the dashboard supports actual decision-making behaviour.
⚙️ Approach 4
Simplified presentation of data to:
Minimise interpretation effort
Avoid unnecessary complexity
👉 Allows operators to focus on action rather than analysis.


📦 Outcome
Improved real-time visibility into workload and productivity for warehouse operators
Reduced time spent interpreting data and switching between systems
Enabled faster identification of workload imbalances and operational issues
Provided a clearer, more structured view of performance without increasing cognitive load
Selected UX Work